


The dashboard - the big picture at a glance
With the dashboard, you can see all the key figures of your events displayed on one page. Which events have already been created and what is the booking status of individual events? Which emails have already been sent out, how many contacts have been reached and how many of the emails have been opened? How many new contacts are in the database and, most importantly, how much is the turnover that has been generated through bookings?
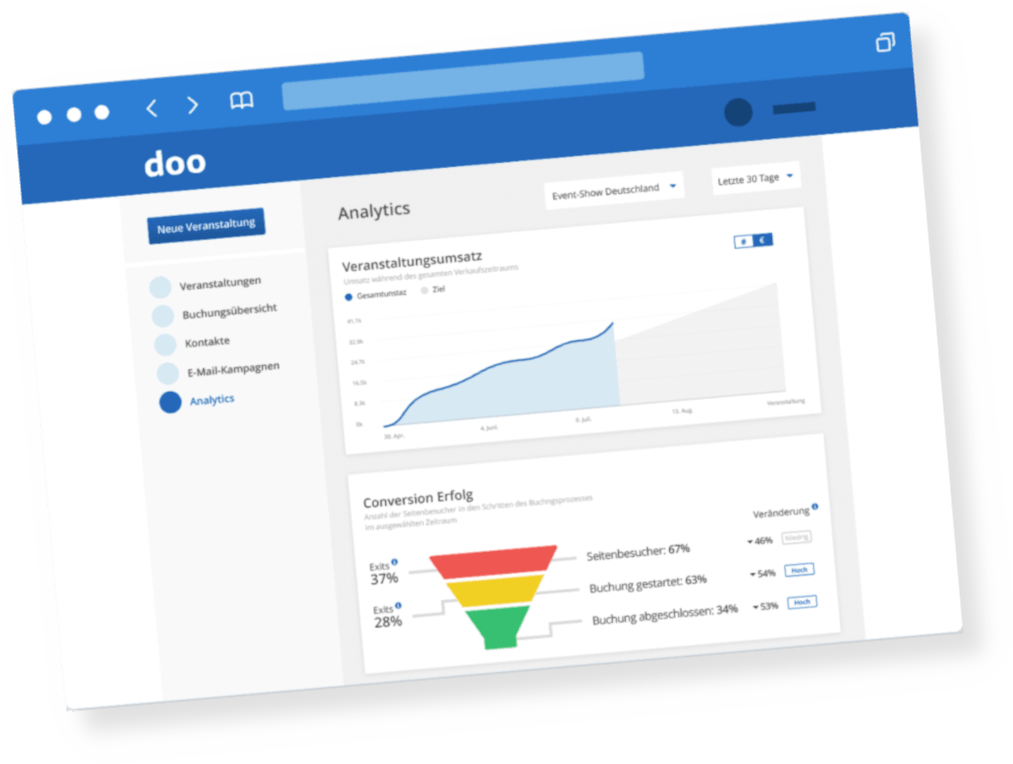
Detailed statistics in each module
In addition to the overriding dashboard, numerous detailed statistics are available for each module. For example, you get a detailed look at how successful each individual email was in your email success report. You can also see how many participants have registered for your events at a glance. You not only get to see which ticket categories and which additional products have been booked, as well as how often, but also whether maximum event capacity has already been reached.
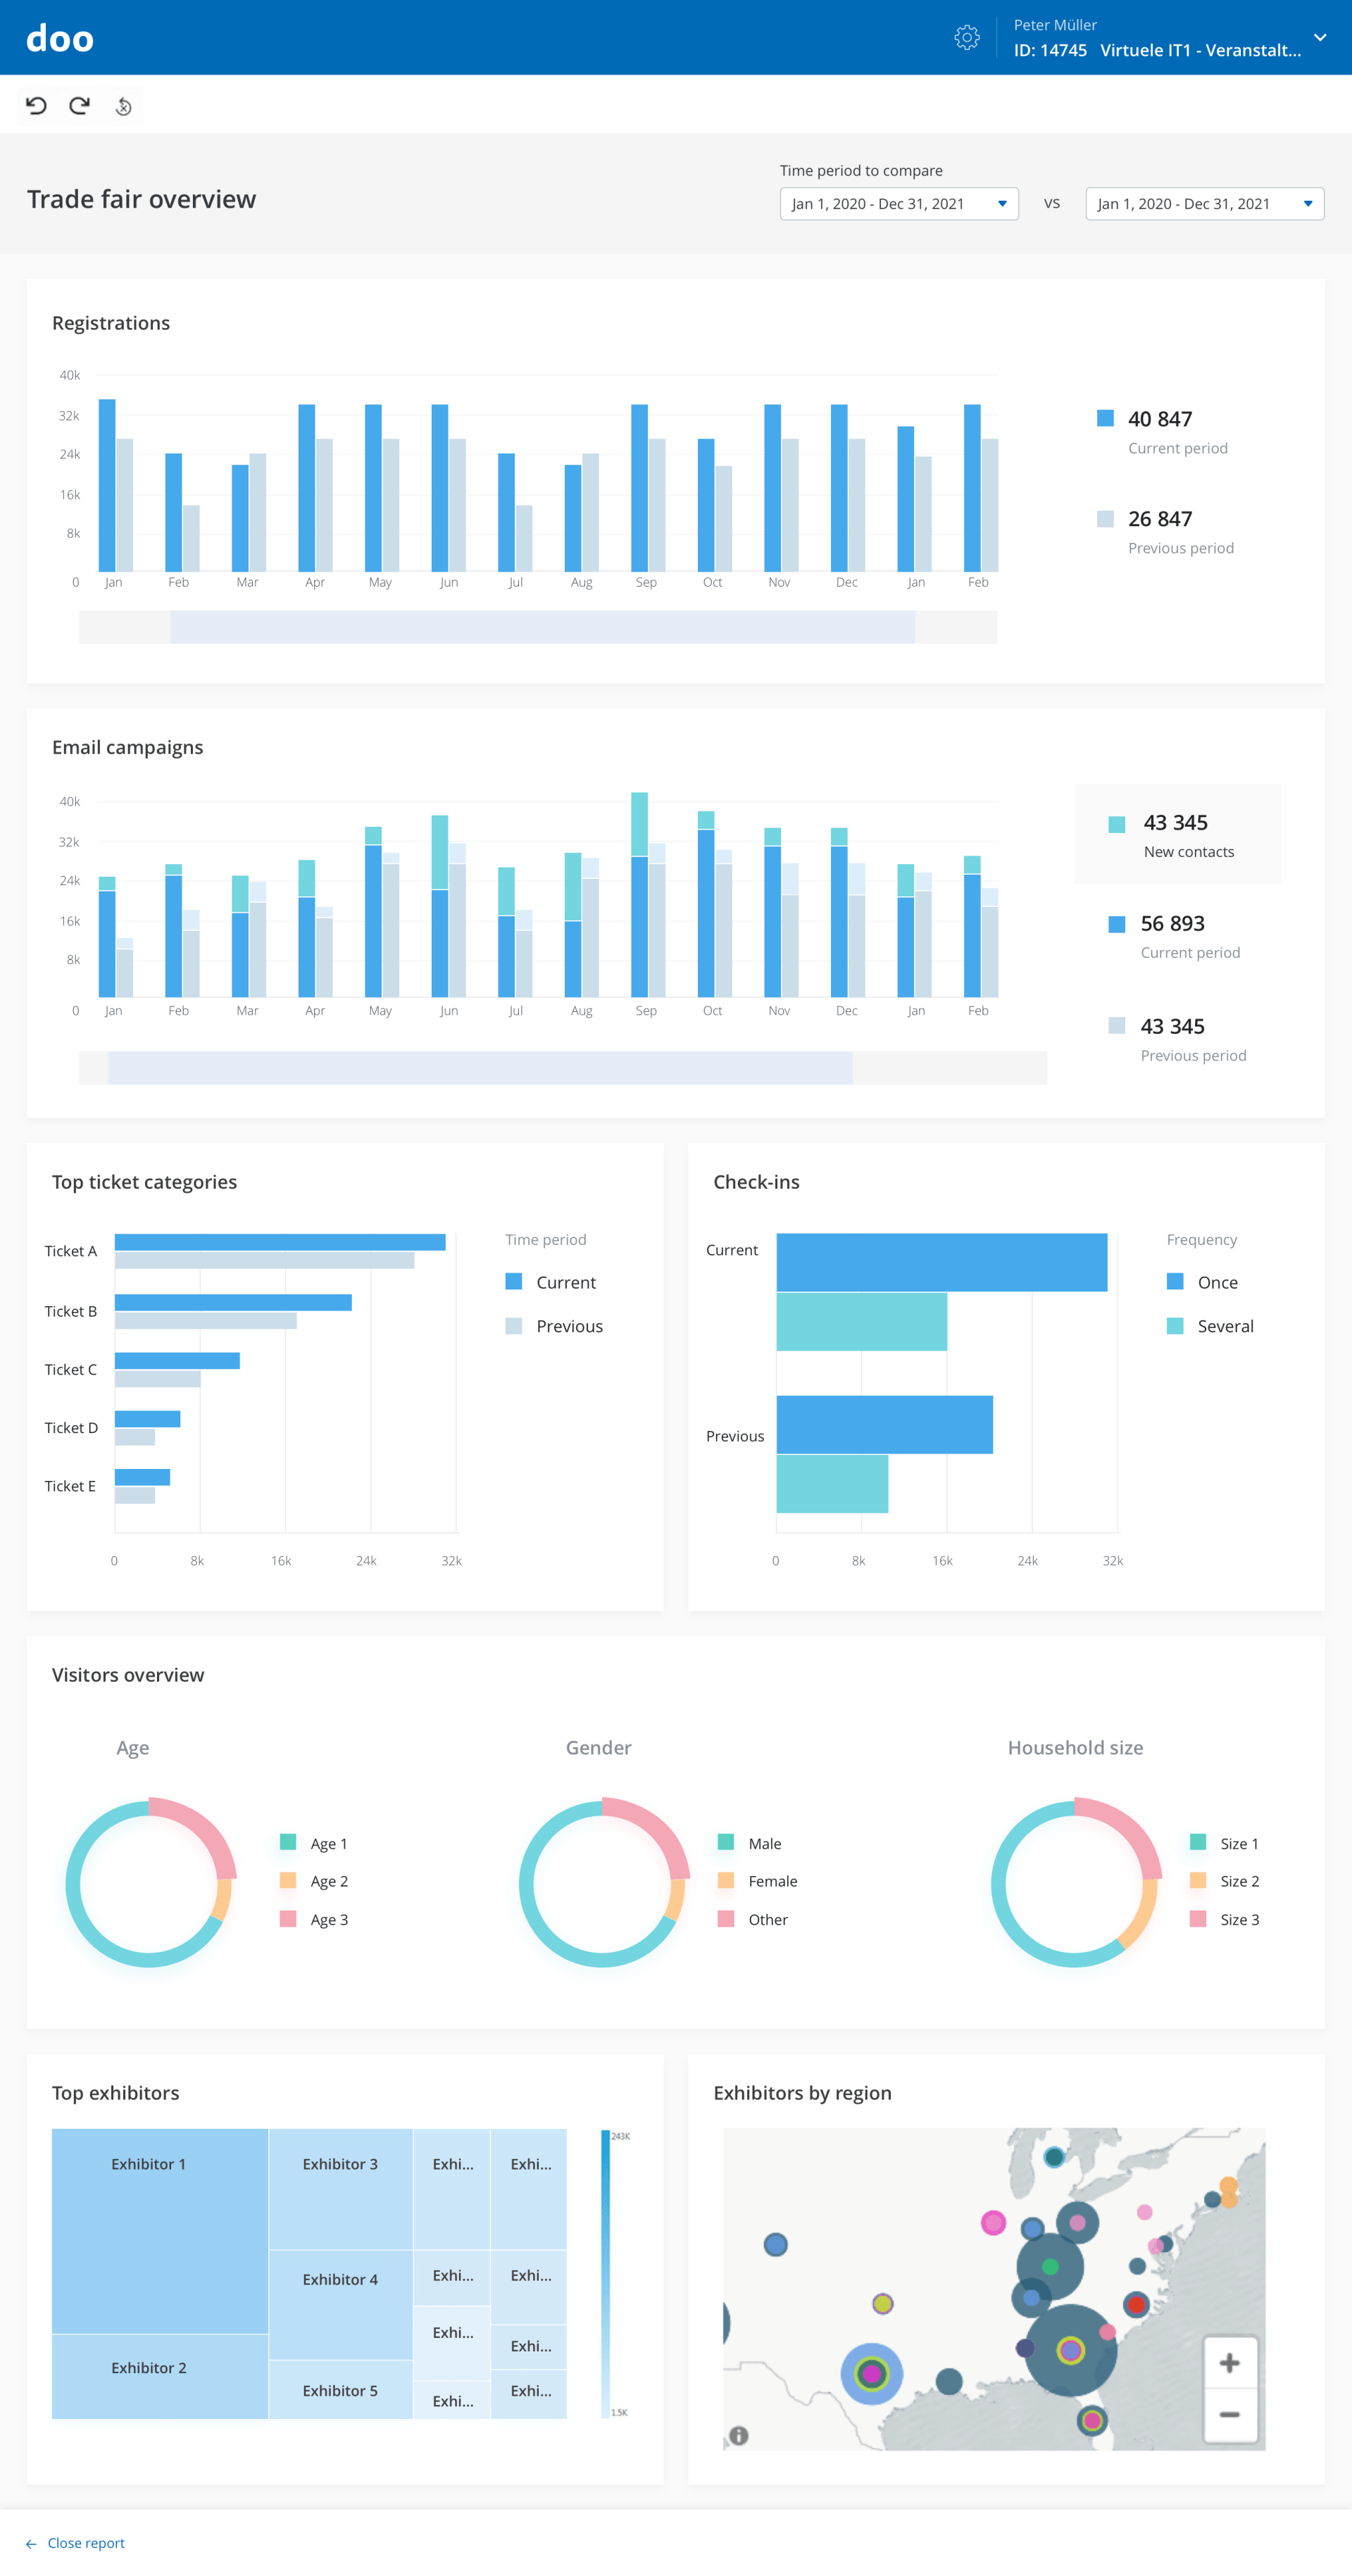
Individual, comprehensive reports
There is a separate area for individual and cross-module reports. Additional reports tailored to your goals and KPIs can be stored here. Whether you want to keep track of your event’s carbon footprint or want to know where your attendees come from on each day of your event, the possibilities for gaining insights from your data are practically endless.